Many professional investors assert stock chart pattern recognition as a part of “rules-based” investing which includes, stock chart patterns such as “Cup with Handle” chart formations. The process of stock selection through the use of stock chart patterns relies on the notion that these price patterns repeat themselves over time as a function market mechanics and investor sentiment. In many instances, the “Cup with Handle” Chart formation portends future growth in stock price when certain conditions are met. The Rules-Based Investing process is designed to remove emotion and personal bias, resulting a disciplined approach for the entire portfolio management process.
Cup with Handle Chart Patterns
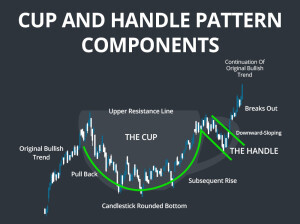 In most instance, but not all, a Cup with Handle Chart Pattern that is a “U-Shape” versus a “V-Shape” is preferred. This pattern characteristic is interpreted to mean that the stock has had the needed time for short-term speculative investors to sell positions which results in the remaining investor who have a longer-term investment time horizon. During periods of general market declines, it is not unusual for growth stocks to decline twice the overall market averages. Many times, the percentage decline is a function of the severity of the general market decline and the extent of the stock’s prior price run-up. Next, the chart formation of the “handle” must be formed above the stock’s 200-day moving average price line. If not, the demand by investors has not been strong enough to recover prior investors’ losses to allow stock price to continue upward price momentum.
Technical Analysis
Technical Analysis relates to the investment decision-making process which determines whether the overall market indicators are in a “positive” uptrend. Once the overall market conditions are positive, individual securities can be selected from the list of prospective securities investments generated by the fundamental analysis. Investment portfolios are constructed through a two-step process which include, both fundamental analysis and technical analysis. First, a fundamental analysis is utilized as a part of a selection process to discover potential investment candidates for a client’s investment portfolio. Secondly, a technical analysis is utilized to determine direction of market trends and individual security price/volume movements, utilizing technical chart pattern formations such as “Cup with Handle” chart formations for buy/sell/hold investment decision-making. True North Financial Advisors manages investment portfolios on a continuous and ongoing process to monitor portfolio holdings.
Rules-Based Investing Approach Help Answer Questions
How to identify securities for your investment portfolio that is the most suitable for you? How does a “Cup with Handle” Chart Formation help select stock investments? How do I protect portfolio gains? How can I limit stock losses? Why is the market trend important for investors? How to determine whether the market is in an uptrend or downtrend? How to detect a change in the market trends? How often should your portfolio be monitored for buy/sell/hold decisions? For answers to these questions, contact True North Financial Advisors for a detailed review of your investment portfolio.
Important Disclosures
True North Financial Advisors provides rules-based investment strategies in discretionary investment accounts designed to protect profits and limit losses. All investment strategies involve risk and may result in the loss of principal. Investors are encouraged to contact True North Financial Advisors for more details.